Data Analytics 101: How Data is Stored.
Part 1: How Data is Stored.
Tables make data easy to understand and work with; however, not all data must be arranged in a table. This article will look at data types (formats) and how they are stored and processed.
To begin, we need to look at tables holding data and how they are analysed. Most tables are organised in records, having fields and attributes to help users interpret them. But what is a field, and how does it relate to organising data?
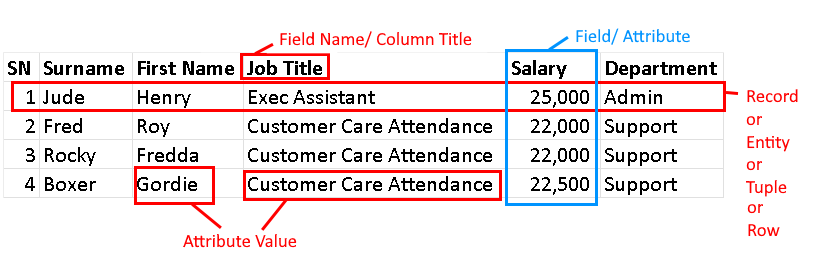
In data science, a field refers to a grouping topic or category containing related attributes. On the other hand, attributes are specific characteristics or properties that describe an object or an entity in a dataset.
For instance, in a dataset containing employee information, a single record could include attributes such as "First Name", "Last Name", "Job Title", "Salary", and "Department". Each of these attributes provides detailed information about the employees in the dataset.
Therefore, while a field represents a larger category or topic, an attribute provides specific information about an object or entity within that category.

Data Formats.
Data is easily organised into three main categories:
Structured
Semi-Structured
Unstructured
Structured Data Formats.
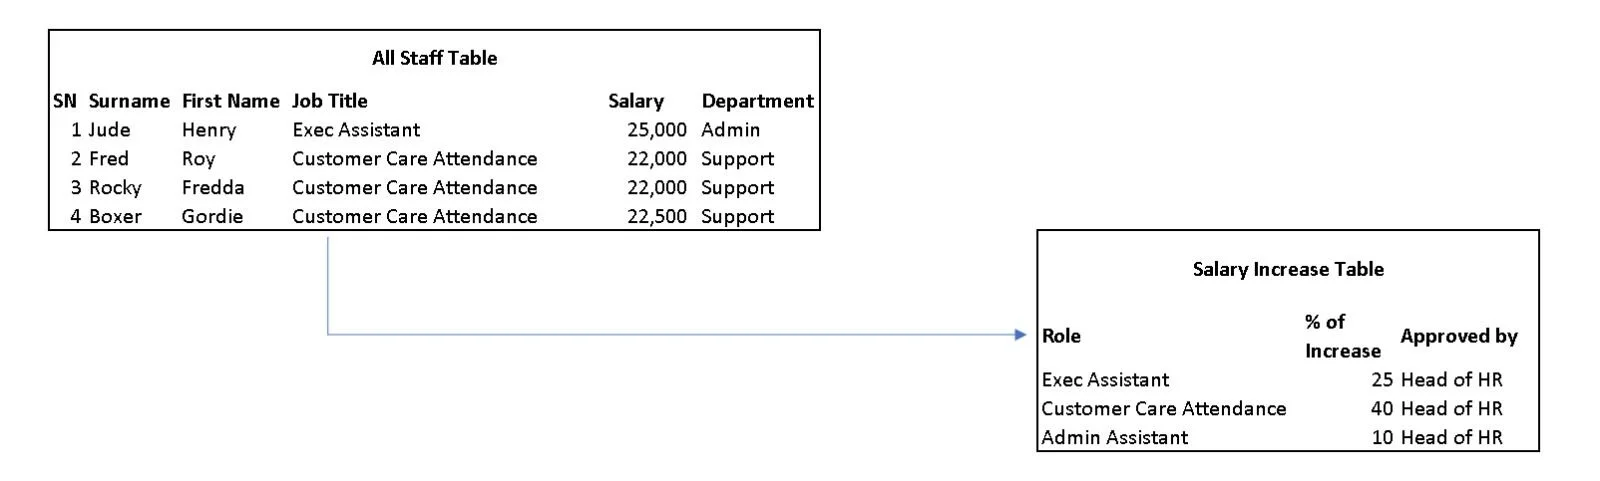
Structured Formats mainly include SQL (Structured Query Language) files and Excel (including other spreadsheets) files. They are structured in human-readable, easy-to-understand tables that show you what each item represents. Each table in a structured data file is often linked to other tables to create relationships. These linkages help you to understand the big picture of the data. The table below shows an example of two linked tables as part of structured data. The field “job title” links the first table to “role” in the second table.
Semi-Structured Data Format.
Comma Separated Values are probably the most common type of semi-structured data format, allowing you to store the data in a text-based form that allows importing into databases or spreadsheet applications. The example below shows four entities with fields matching their first name, last name and email.
First Name,Last Name,Email
Fred Linna,fread8990387@gmail.com
Toon Manny,toons560993@gmail.com
Reda Frank,real56940@gmail.com
Nonny Allen,noneto89330@gmail.com
JSON data formats allow for some level of structure, and you can easily edit them once you understand how they are formatted. They are relatively easy for humans to read and understand but less so compared to structured data formats. Below is a simple JSON schema helping you to see how objects are stored in them.
[
{
“color”: "red",
“tool”: "screwdriver"
},
{
“color”: "yellow",
“tool”: "hammer"
},
{
“color”: "black",
“tool”: "hammer"
}
]
From the example above, we see two hammers and one screwdriver. One of the hammers is yellow, the other is black, and the screwdriver is red.
Another common semi-structured data format is XML (extensible markup language).
Unstructured Data.
Videos, audios, and analogue books are examples of unstructured data, and they are difficult to build data models to analyse or organise. These days we are able to mine and analyse these types of data using many tools which take unstructured data and mine out the data to give us some structured or semi-structured data. Unstructured data are often large files stored as BLOBs (binary large objects). As the name suggests, BLOBs are binary (ones and zeros) and stored in formats that are hard for humans to read.
Part 2: How Data is Processed.
Online Transaction Processing systems (OLTP) are at the heart of banking, point of sale, and e-commerce operations. They allow organisations to handle large amounts of data in real-time (thousands or millions of transactions per hour). Imagine a world without a system to process such high-volume transactions or what it might be if it wasn't reliable. Blips in people's trust in the OLTP system can cause widespread panic; as such, banks do everything to reinforce that confidence. To achieve such a robust system, every transaction must pass a benchmark, well-enforced by all stakeholders. The ACID acronym (Atomicity, Consistency, Isolation, Durability) conveys the benchmark properties of a good OLTP system.
The atomicity property ensures that transactions aren't handled as a group, regardless of how related they are. It also ensures that each is dealt with uniquely as a single unit of work.
Consistency ensures that transactions leave the database in a valid state and arrive at their destination in an equally valid state. This property ensures that all the constraints and rules defined in the database are satisfied. The database administrator typically sets the rules and constraints in a database to ensure the consistency of data.
Isolation ensures that transactions are executed independently of each other and are not affected by other transactions running simultaneously.
Durability ensures that once a transaction is committed, it is permanently saved in the database and needs to be that way, regardless of any potential hardware or software failures (similar to guaranteeing data integrity).
Both atomicity and isolation properties ensure that every OLTP system treats the data in a way that no partial changes to that data are committed. When followed, all transactions are executed accurately, and partial updates or inconsistencies are accepted.
How Does Data Move in Very Large Data Systems?
Data moves between data lakes, warehouses, OLTP storages and culminates in analytical dashboards. Why does data often end up in dashboards? Because most consumers of data require graphical, easy-to-interpret formats that summarise all the complex and large data appropriately.
Data Collection: Data is collected from various sources, including applications, websites, device sensors, and mobiles and is then pulled into a data lake or an OLTP storage system.
Data Processing: From the Data lake or OLTP storage, the data is transformed and cleaned to ensure that it is in a usable format. Besides cleaning (like removing unnecessary spaces), data processing involves normalising the data (an example of normalisation is ensuring that all instances of “rd” and “road” are corrected for consistency) and that duplicates are removed. Data lakes are typically used for storing raw data requiring data processing.
Data Storage: Once the data is processed, it is stored in a data warehouse. Warehouses are used for storing processed and structured data that is optimised and ready for analytics.
Data Modeling: The data from the warehouse is then modelled to create a schema optimised for analytical queries. Data modelling is the process of organising data in a way that makes sense for the specific purpose of analysing it. For example, if you are analysing customer data, you should create a data model that shows the relationships between customers, products, and orders. Modelling allows you to see how customers are interacting with your products and how that is affecting your sales.
Data Querying: Analytical queries are executed against the data warehouse or data lake using SQL, R or Python (programming languages). These queries are designed to extract insights from the data and answer specific business questions. Data scientists often write scripts to query data in data lakes or warehouses, while data analysts focus more on modelling data from data warehouses.
Data Visualisation: The results of the analytical queries are then presented in a visual format, such as a dashboard or a report. Reports allow business users to gain insights into data and make data-driven decisions that will impact their organisations.